Reports Overview
The Reports section provides a detailed breakdown of your sales and transaction data over a selected period. This feature helps you track your business performance, identify trends, and make informed decisions based on accurate financial insights.
Customising Date Ranges
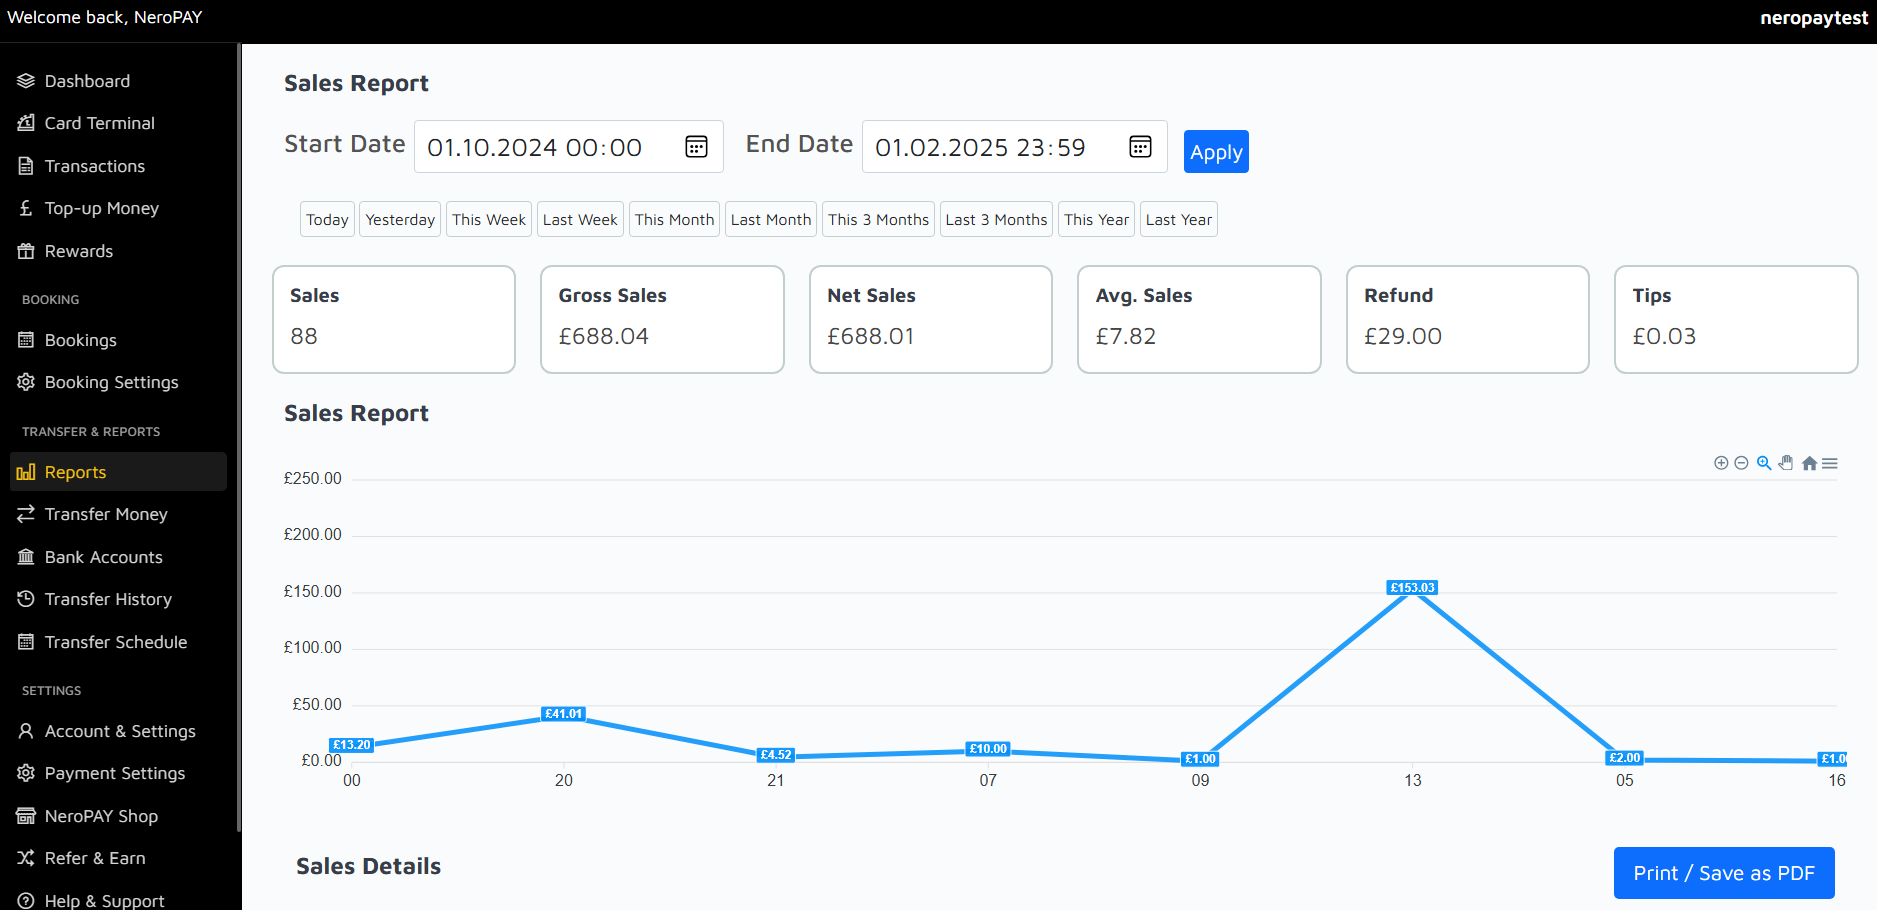
Use the date range selector at the top to filter your sales data. You can choose predefined ranges, such as "Today," "This Week," or "Last Month," or set custom start and end dates to view specific time periods. Once you’ve selected a range, click "Apply" to update the report.
Key Metrics Displayed
Sales
Total number of transactions completed during the selected period.
Gross Sales
The total amount of revenue generated before deductions like refunds or tips.
Net Sales
Your revenue after accounting for refunds and deductions.
Average Sales
The average value of a transaction, calculated as net sales divided by the number of sales.
Refund
The total amount refunded to customers during the selected period.
Tips
The total tips received from customers, if applicable.
Sales Report Graph
The Sales Report graph visually represents your sales performance over time. Hover over points on the graph to view details of sales for specific dates. This tool is useful for identifying peak sales periods and monitoring trends in your business activity.
Sales Details
A detailed list of individual sales transactions is displayed below the graph. This section allows you to examine each transaction's specifics, including date, amount, and status. Use this information to review your operations and address any anomalies.
Exporting Reports
To save or share your reports, use the "Print / Save as PDF" option at the bottom of the page. This feature allows you to generate professional documents for record-keeping or external reporting purposes.
Why Use Reports?
- Gain a clear understanding of your business performance.
- Track revenue, refunds, and tips over time.
- Identify patterns and trends in your sales activity.
- Use data-driven insights to make informed business decisions.
Sales Details Breakdown
This section provides a detailed breakdown of your sales, helping you understand the composition of your revenue. Each category reflects a specific component of your total sales.
Product Sales
The total revenue generated from the sale of products. This is the primary source of income for most businesses.
Service Charges
Additional charges for services provided, such as delivery or special handling. This value will be displayed if applicable.
Tax Fees
The amount of tax collected on sales, which varies depending on your region and tax regulations.
Additional Fees
Any extra fees applied, such as processing or handling charges. These fees are detailed separately for transparency.
Tips
The total tips received from customers, typically in hospitality or service-related industries.
Discount
The total value of discounts applied to transactions, such as promotional offers or loyalty rewards.
Refunds
The amount refunded to customers during the reporting period. This is subtracted from your gross sales.
Total Sales
The net revenue calculated after accounting for refunds, discounts, and other deductions. This represents your final earnings for the selected period.
Important Notes
- You can cancel your contract with NeroPAY at any time if necessary.
- Compare your current contract details using the pricing summary or similar tools provided by NeroPAY.
- Fees, including infrastructure and interchange charges, are deducted automatically and reflected in your total sales.
- Security fees ensure a safer shopping experience and are deducted to cover operational security measures.
- Only net amounts after deductions are displayed in this breakdown for clarity and accuracy.
- Any discrepancies in small amounts, such as pence, may occur due to rounding calculations and should not affect larger totals.
- Detailed monthly invoices include all fees, ensuring complete transparency.