How to generate a financial report
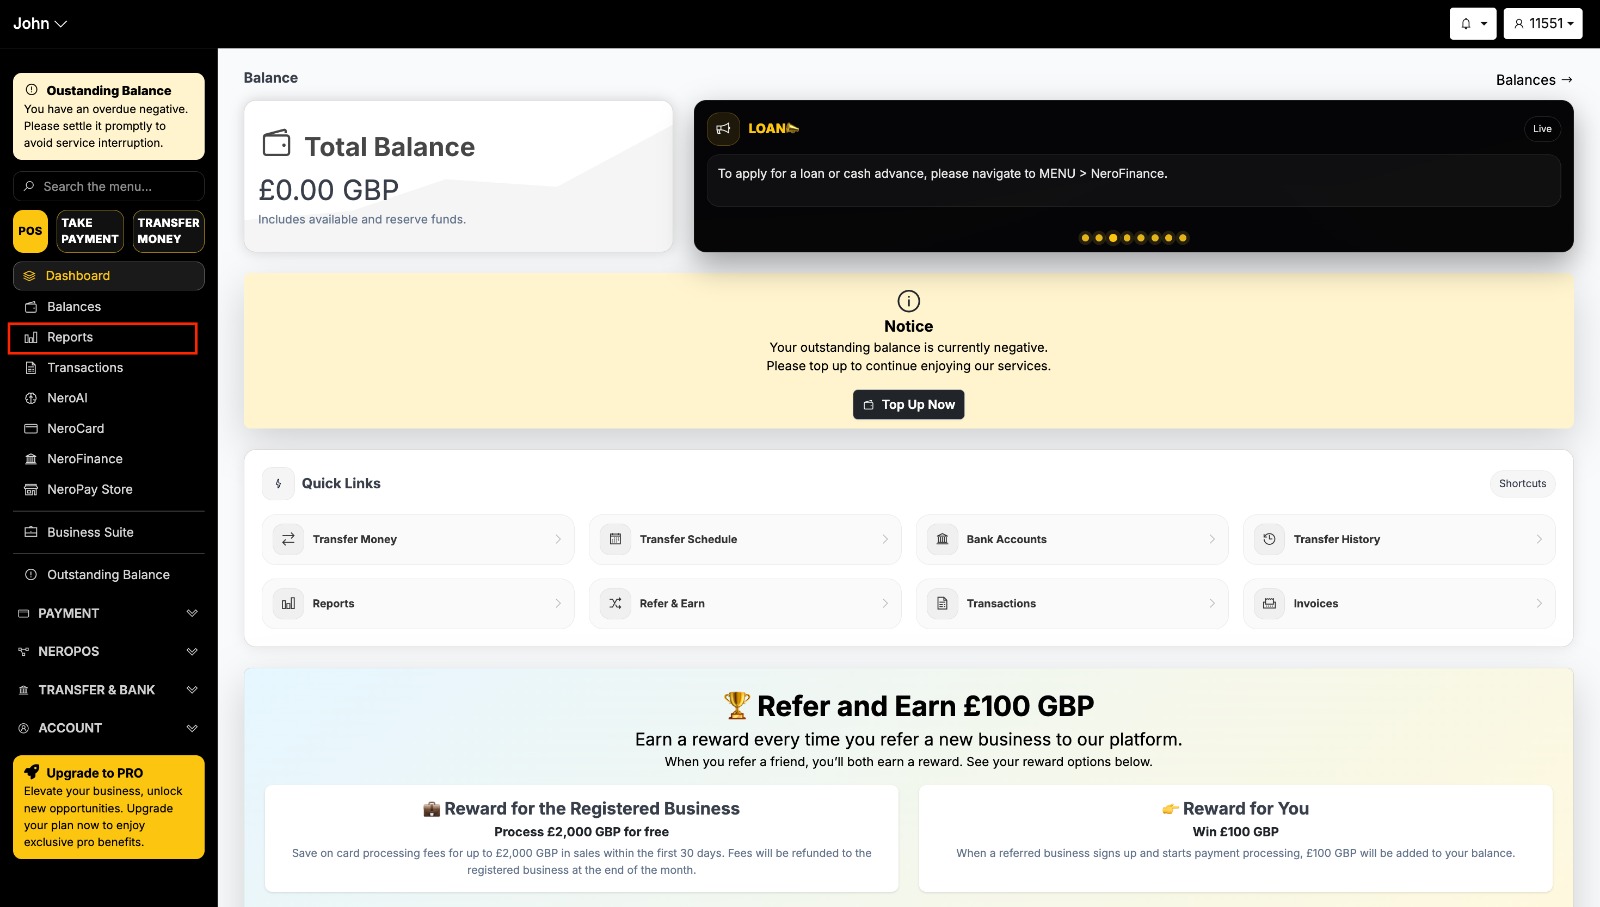
- Log in to your Dashboard
- From the left-hand menu, click Report
- Use the filters to narrow down your data, such as date range or transaction type
- Select which account to generate the report for:
- Personal account
- Business account
- Total — combined accounts
- The system will generate your report automatically
📸
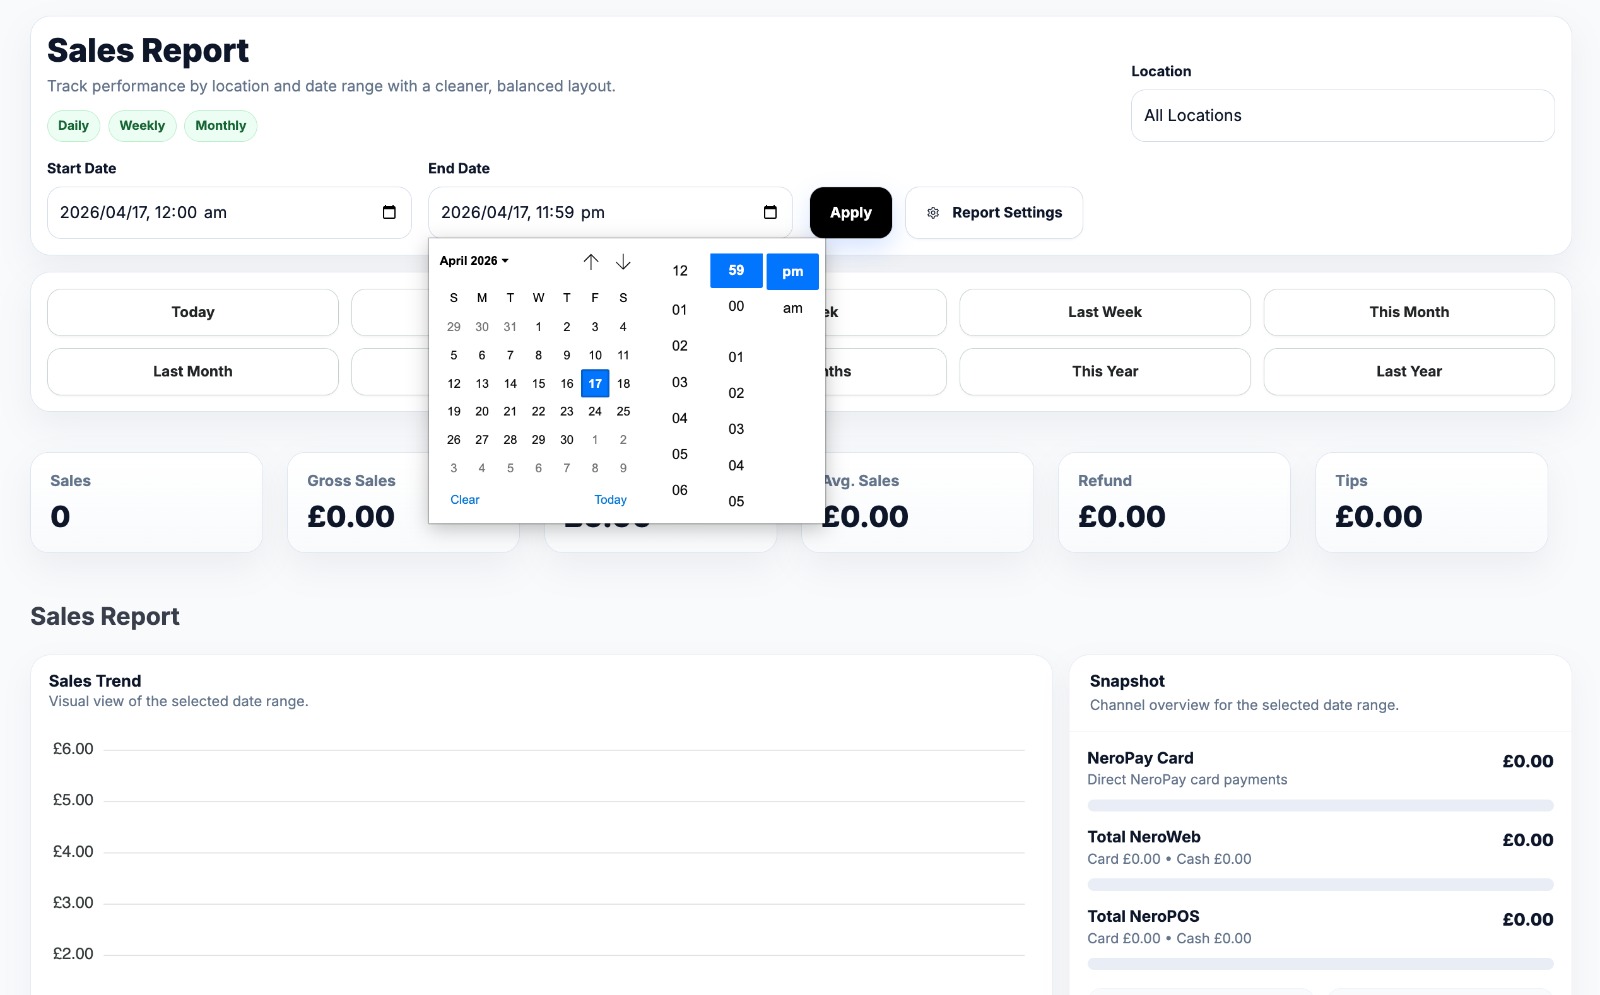
Customising your date range
Use the date range selector at the top of the page to filter your data. You can choose from predefined options such as Today, This Week, or Last Month — or set a custom start and end date for a specific period. Once selected, click Apply to update the report.
📸
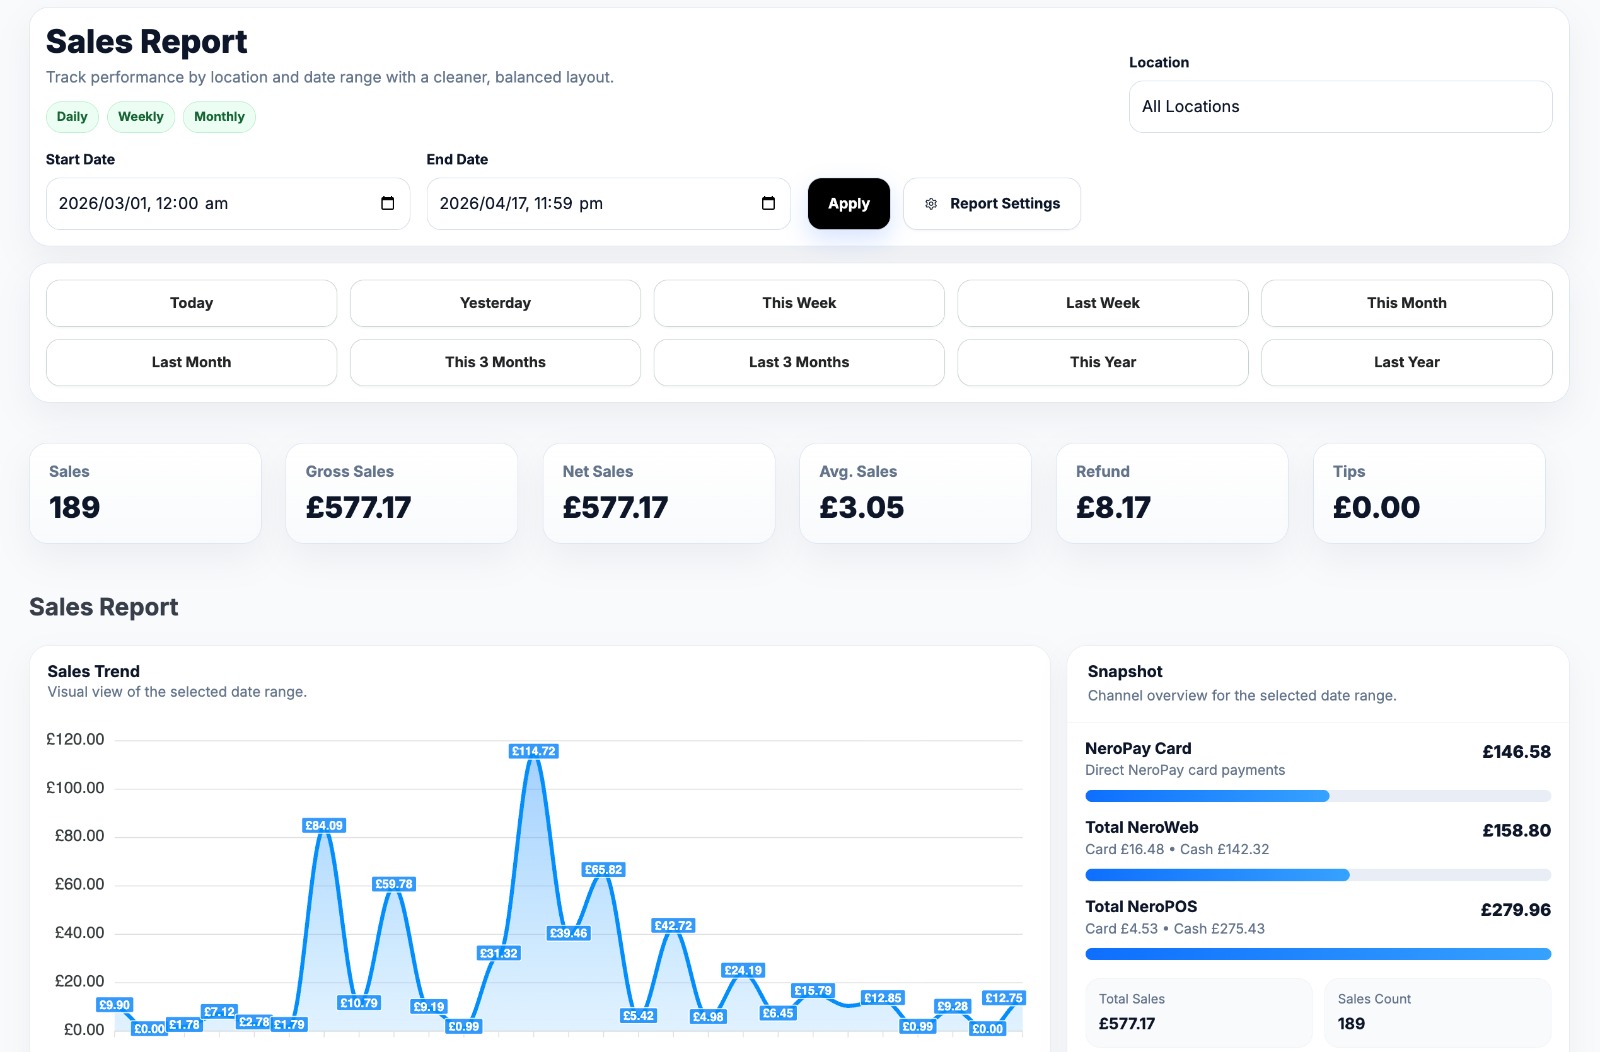
Key metrics explained
| Metric | What it means |
|---|---|
| Sales | Total number of completed transactions in the selected period |
| Gross Sales | Total revenue generated before any deductions |
| Net Sales | Revenue after refunds and deductions |
| Average Sales | Net sales divided by number of transactions |
| Refunds | Total amount refunded to customers |
| Tips | Total tips received, if applicable |
Sales report graph
The graph gives you a visual overview of your sales performance over time. Hover over any point on the graph to see the sales details for that specific date. Use this to identify peak periods and monitor trends in your business activity.
📸
Sales details
Below the graph, you'll find a full list of individual transactions, including date, amount, and status. Use this to review your operations and investigate any anomalies.
Sales details breakdown
This section shows the full composition of your revenue:
| Category | What it includes |
|---|---|
| Product Sales | Revenue from products sold |
| Service Charges | Additional charges such as delivery or special handling, if applicable |
| Tax Fees | Tax collected on sales, based on your region and regulations |
| Additional Fees | Processing or handling charges, listed separately for transparency |
| Tips | Tips received from customers |
| Discount | Total value of discounts applied, such as promotions or loyalty rewards |
| Refunds | Amount refunded to customers, subtracted from gross sales |
| Total Sales | Net revenue after all refunds, discounts, and deductions |
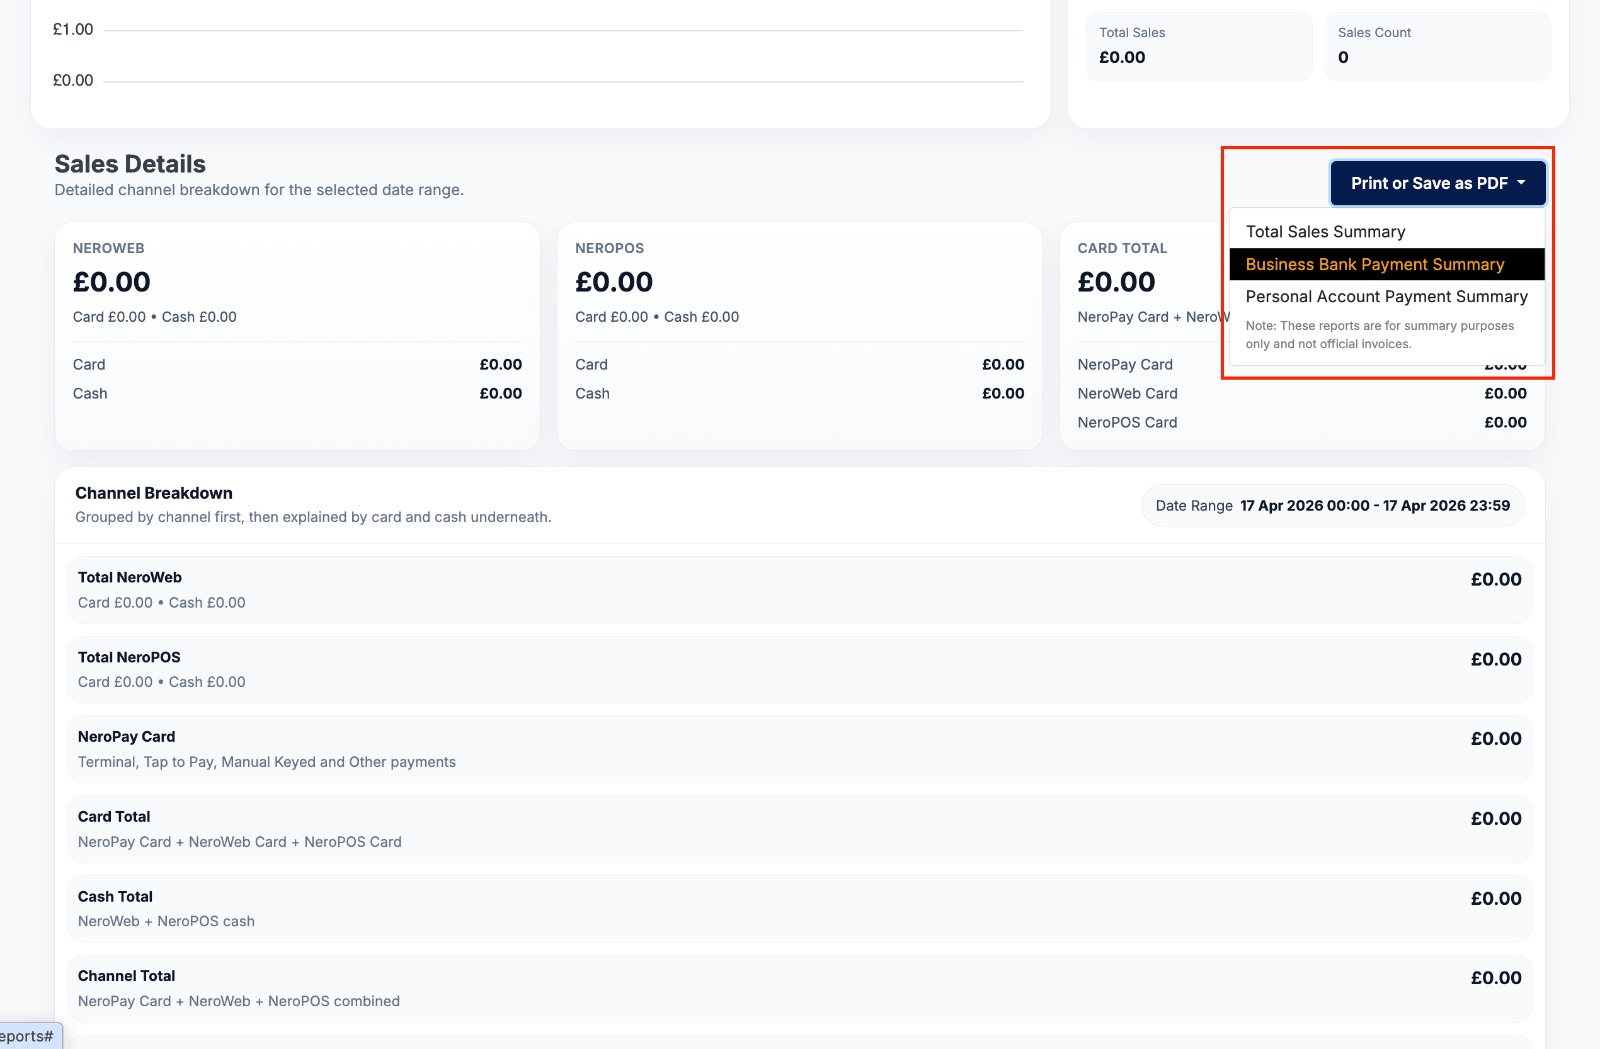
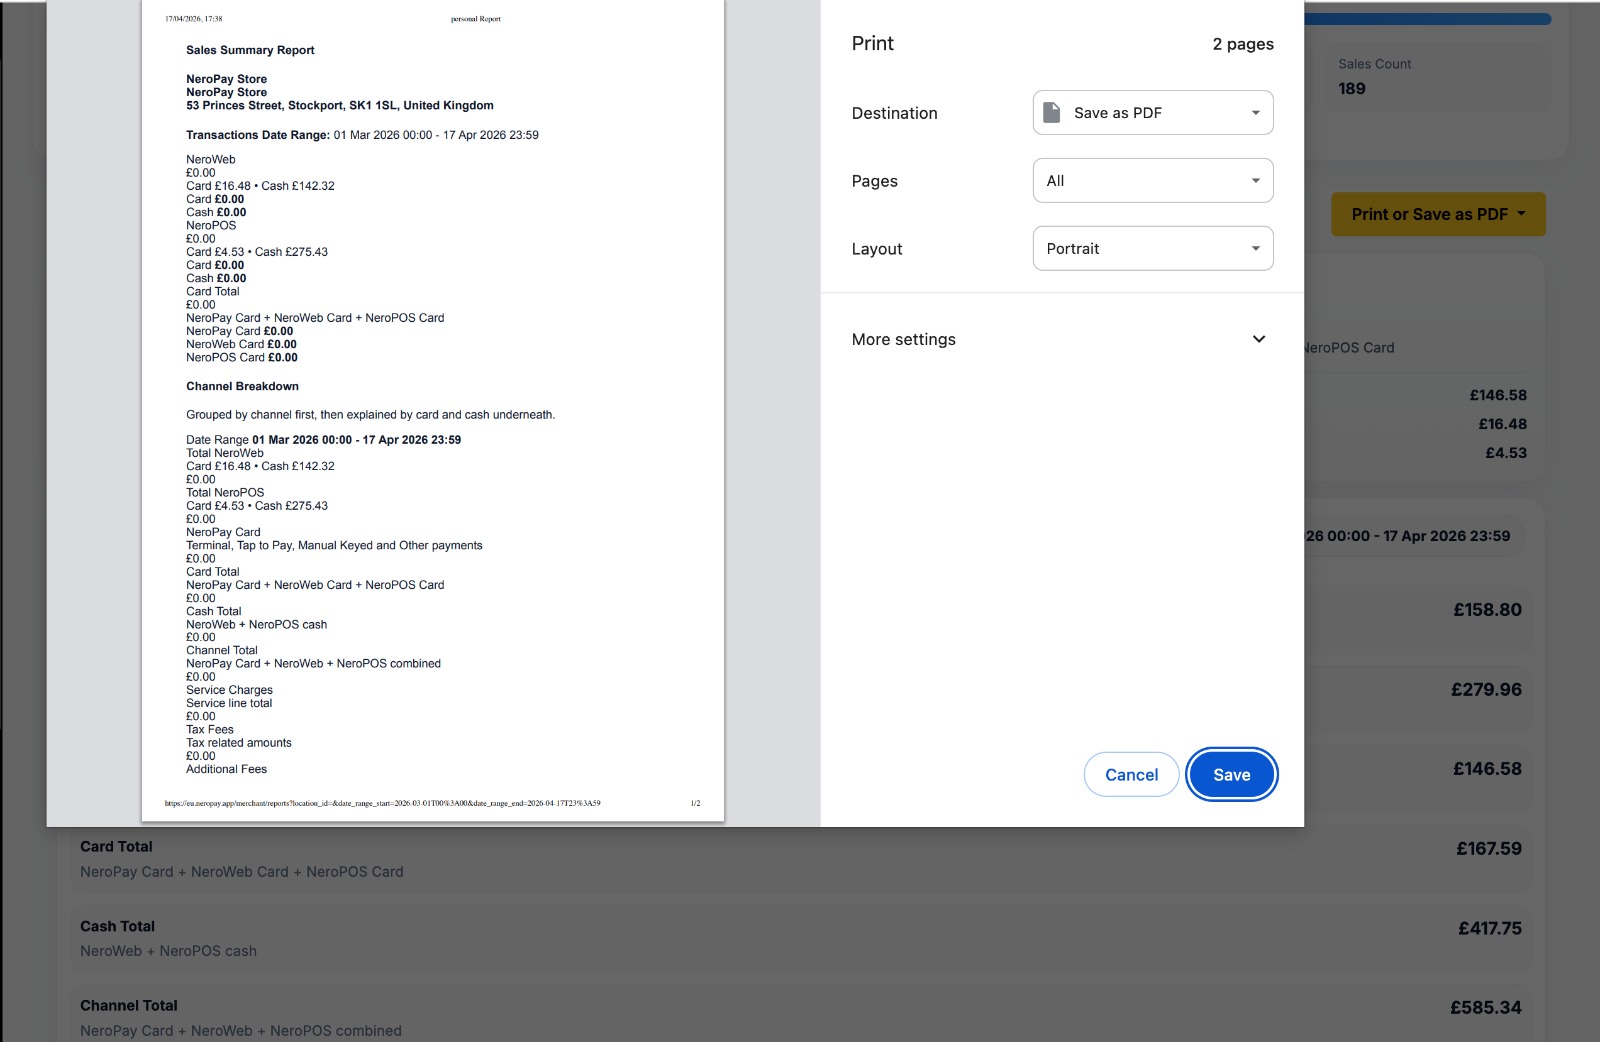
Exporting your report
To save or share a report, use the Print / Save as PDF option at the bottom of the page. This generates a professional document suitable for record-keeping or external reporting.
📸
Important notes
- You can cancel your contract with NeroPay at any time if necessary
- Fees, including infrastructure and interchange charges, are deducted automatically and reflected in your total sales
- Security fees are deducted to cover operational security measures
- Only net amounts after deductions are displayed in the breakdown
- Small discrepancies in pence may occur due to rounding and will not affect larger totals
- Detailed monthly invoices include all fees for full transparency
Frequently asked questions
Q: What is the difference between Gross Sales and Net Sales? A: Gross Sales is your total revenue before any deductions. Net Sales is what remains after refunds and other deductions have been applied.
Q: Can I export my report? A: Yes — use the Print / Save as PDF option at the bottom of the page to save or share your report.
Q: Why does my Total Sales figure look lower than expected? A: Total Sales reflects your net revenue after all fees, refunds, and discounts have been deducted. Check the Sales Details Breakdown for a full view of what has been applied.
Q: Can I view reports for both my personal and business accounts separately? A: Yes — when generating a report, simply select Personal, Business, or Total depending on what you need.
Still need help? Contact us at support@neropay.app or create a ticket